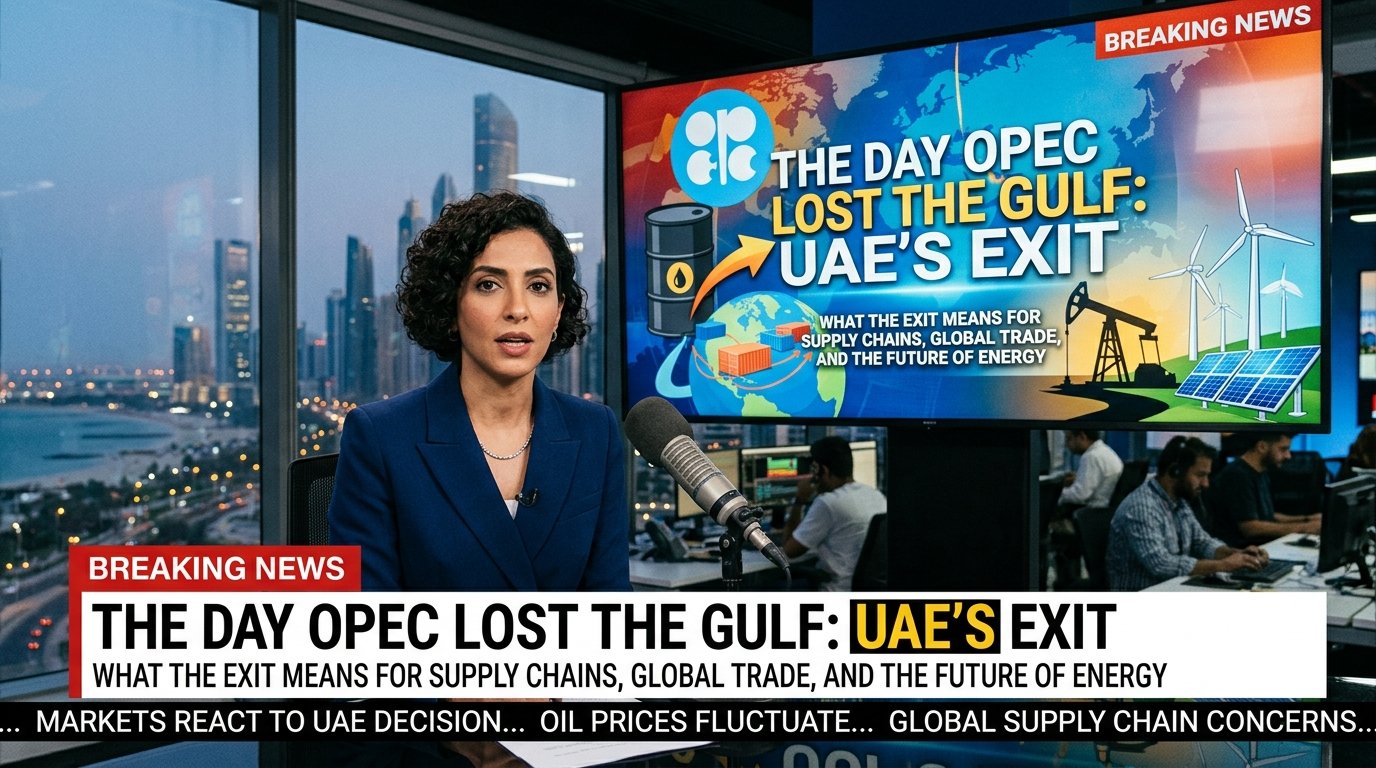
The Day OPEC Lost the Gulf: What the UAE’s Exit Means for Supply Chains, Global Trade, and the Future of Energy
A practitioner’s deep-dive into the most consequential energy realignment in a generation
By Arshad Azhar | Director of Logistics & Freight Forwarding | 20+ Years GCC Supply Chain | Published Author
29 April 2026
Estimated read time: 18–22 minutes
Preface: Why This Matters More Than the Headlines Suggest
When a country that has been a member of an organization for nearly six decades walks out in three days’ notice, you know the decision was not made in haste. It was made because the accumulation of tension, constraint, and strategic mismatch had finally crossed a threshold that no amount of diplomatic patience could contain.
On Tuesday, 28 April 2026, the United Arab Emirates announced its departure from OPEC and the wider OPEC+ alliance, effective 1 May 2026.
Most news coverage has understandably focused on oil prices, geopolitical signalling, and the blow to Saudi Arabia’s leadership of the cartel. These are important stories. But they are not the whole story — and for the hundreds of thousands of supply chain professionals, logistics operators, freight forwarders, procurement leaders, and trade finance specialists who keep the global economy moving, they are not even the most urgent story.
What happened on 28 April 2026 is not just an energy market event. It is a supply chain inflection point. It is a trade corridor reshaping. It is a procurement risk event. It is, in the language of my profession, a systemic shock that will ripple through freight rates, fuel surcharges, inventory strategies, and global sourcing decisions for years.
I have spent more than two decades managing multimodal freight operations across the GCC — air, sea, and overland corridors, across 10+ markets. I have navigated the Red Sea disruptions of recent years, COVID-era port congestion, and the post-pandemic freight rate collapse. I know what a genuine supply chain shock looks like. This is one. And it is compounded by a context that makes it unlike anything I have seen in my career.
So let me take you through this properly. Not just what happened, but why, and — more importantly — what comes next for everyone who moves goods for a living.
Part I: The 58-Year Marriage That Was Always Complicated
To understand why the UAE left OPEC, you have to understand why the relationship was always more complicated than it appeared from the outside.
The UAE’s membership in OPEC began not as the UAE at all, but as the Emirate of Abu Dhabi, which joined the organisation in 1967 — seven years after OPEC was founded by Saudi Arabia, Iran, Iraq, Venezuela, and Kuwait in 1960. When the UAE federation was established in 1971, that membership was consolidated under the new nation.
For most of those 58 years, the relationship worked well enough. OPEC provided a framework for coordinated production decisions that kept oil prices in a range acceptable to producers. The UAE, with its rapidly expanding production capacity and growing strategic importance as a logistics and financial hub, was one of OPEC’s most compliant and influential members. It punched above its weight inside the cartel’s deliberations, and Saudi Arabia — which functions as OPEC’s de facto leader — valued Emirati support in managing the group’s dynamics.
But the relationship had been straining for years before this week’s announcement. The specific tension: production quotas.
OPEC’s quota system is designed to coordinate supply in order to influence prices. When the group wants prices to rise, it cuts production. When it wants to increase market share, it opens the taps. Historically, this has worked reasonably well — but it requires each member to accept constraints on its own production capacity, even when that capacity far exceeds its quota.
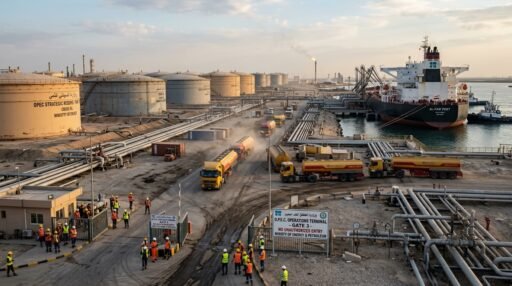
For the UAE, this became increasingly intolerable as ADNOC — Abu Dhabi National Oil Company — systematically invested in raising its production ceiling. After a $150 billion capital investment programme, ADNOC has pushed national capacity to nearly 4.85 million barrels per day, with a clear target of 5 million by 2027 — a target that was brought forward three years ahead of schedule. The country believes it could reach 6 million barrels per day if market conditions demanded it. That would make the UAE the world’s fourth-largest producer, behind only the United States, Saudi Arabia, and Russia.
Here is the problem: OPEC quotas had capped the UAE at around 3.2 million barrels per day. This means that for years, the UAE was producing close to 30% below its actual capacity — leaving enormous potential revenue on the table in service of a collective discipline that it increasingly viewed as working against its national interests.
As one analyst at Saxo Bank put it, the UAE had been sitting under a “production quota straitjacket” for years. The only question was when the frustration would become action.
The Iran war gave Abu Dhabi both the opportunity and the justification to act.
Part II: The Iran Factor — When Your OPEC Partner Attacks Your Ports
There is something almost surreal about the position the UAE found itself in heading into 2026.
On one side of the OPEC table: the UAE, one of the organisation’s most important and compliant members.
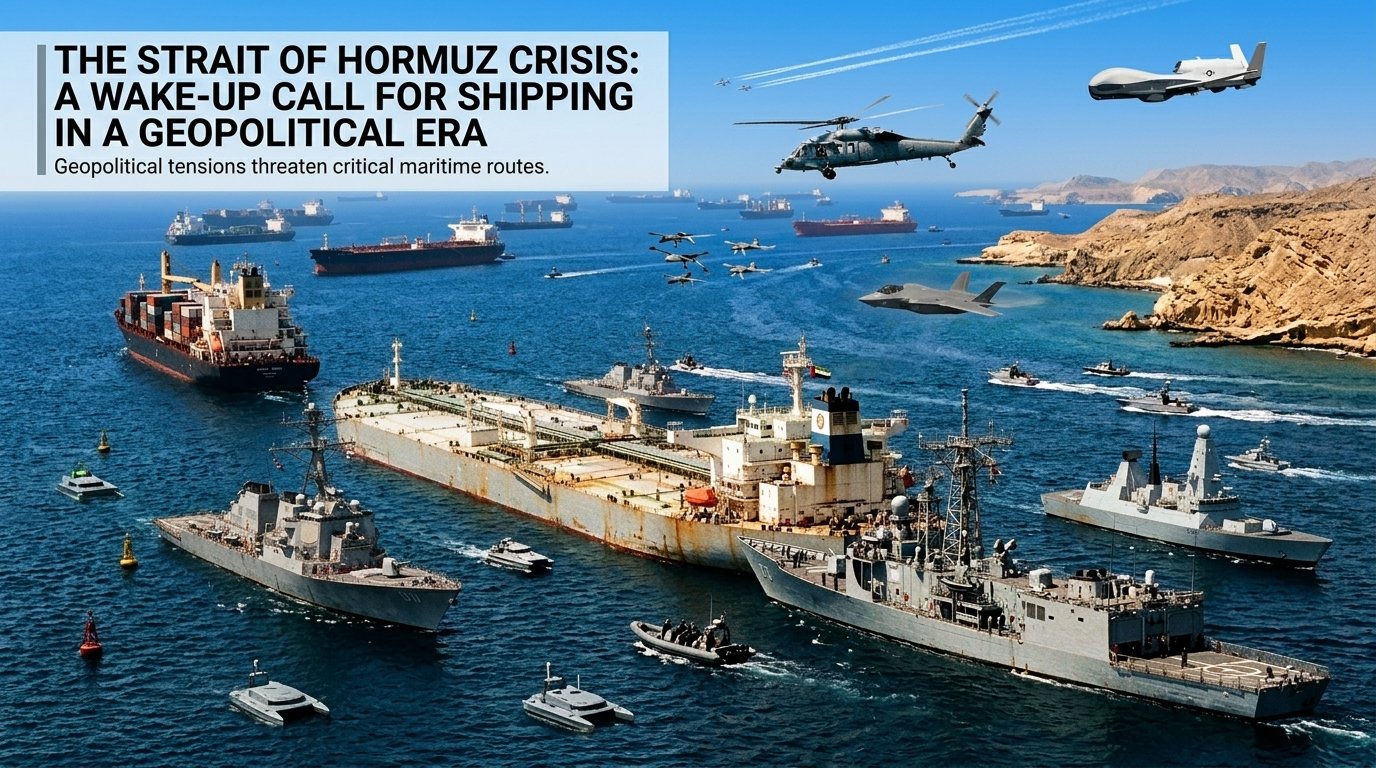
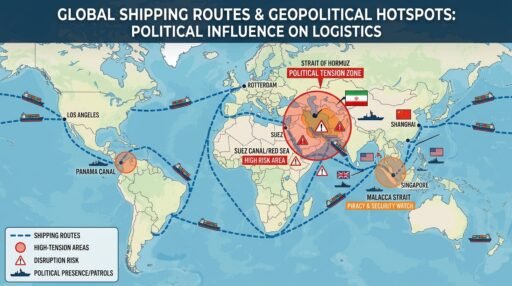
On the other side of the same table: Iran, a founding member of OPEC, which was simultaneously conducting missile and drone strikes against UAE infrastructure, threatening its shipping lanes, and raising the prospect of new tolling mechanisms for passage through the Strait of Hormuz — the narrow waterway through which a fifth of the world’s crude oil and liquefied natural gas normally passes.
Let that sink in for a moment. The UAE was expected to coordinate oil production with a country that was actively attacking its ports.
The Iran war — triggered by the US-Israel conflict — created an unprecedented energy shock. OPEC production fell 27% to 20.79 million barrels per day in March 2026 after disruptions removed nearly 7.88 million barrels per day from supply. To put that in historical context: this supply collapse surpassed OPEC’s production cuts during COVID-19 in May 2020, exceeds the drop from the 1970s oil crisis, and is worse than the 1991 Gulf War impact on supply.
For the UAE specifically, the numbers are stark. The country was producing 3.4 million barrels per day before the war began. By March 2026, production had slumped 44% to just 1.9 million barrels per day — a direct consequence of Hormuz being effectively closed to normal shipping traffic.
The Strait of Hormuz, for those unfamiliar with its strategic significance, is not just an oil chokepoint. It is the jugular vein of the global energy system. At its narrowest point, it is only about 33 kilometres wide. Through this narrow passage, a fifth of the world’s crude oil and liquefied natural gas normally flows. Saudi Arabia, Iraq, Iran, Kuwait, and the UAE all depend on it for the vast majority of their export volumes. When it closes — or even partially restricts — the consequences cascade across every sector of the global economy that depends on energy, which is to say: every sector.
Against this backdrop, the UAE’s Energy Minister Suhail Al Mazrouei made a calculating observation that is worth quoting: the timing of the exit was chosen precisely because the Strait of Hormuz is closed and the immediate market impact of the UAE’s departure would therefore be minimised. In other words, Abu Dhabi chose this moment strategically — exiting when the disruption to its OPEC partners would be limited, but positioning itself to unleash its full production capacity the moment the Strait reopens.
That is not impulsive decision-making. That is long-term strategic positioning executed under the cover of crisis.
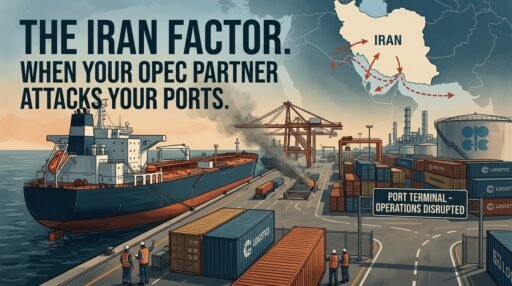
Part III: What OPEC Loses — And What It Reveals
The UAE’s departure is materially significant for OPEC in a way that Angola’s exit in 2024 and Qatar’s in 2019 were not.
The UAE was OPEC’s third-largest producer after Saudi Arabia and Iraq. More importantly, it was second only to Saudi Arabia in terms of spare production capacity — the idle production that can be brought online quickly to address major supply shocks. Spare capacity is the mechanism through which OPEC exercises its real market power. When there is a crisis and prices spike, OPEC can calm markets by promising to open more taps. Without UAE spare capacity in the pool, that stabilisation tool is significantly weaker.
As one analyst at Rystad Energy noted, the UAE’s departure “removes one of the core pillars underpinning OPEC’s ability to manage the market,” making the cartel “structurally weaker.” Saudi Arabia retains its own spare capacity, but its ability to discipline the market — and to manage OPEC as an organisation — is meaningfully diminished without the UAE’s weight.
The longer-term question is whether the UAE’s move sets a precedent. Qatar left in 2019. Angola left in 2024. The UAE leaves in 2026. Analysts are already pointing to Kazakhstan — another significant producer chafing under OPEC+ quota constraints — as a potential next departure. If OPEC+ members begin to calculate, as the UAE did, that the constraints cost more than the coordination benefits, the cartel faces an existential pressure that cannot be resolved by emergency meetings in Vienna.
OPEC was founded in 1960 as a collective response to the pricing power of Western oil companies. It built its relevance on the ability to coordinate supply decisions among a group of producers who individually had limited pricing leverage but collectively could move markets. That model depended on discipline, solidarity, and a shared belief that the collective was stronger than the individual.
The UAE has just demonstrated — publicly and with global attention — that an individual producer can conclude otherwise and act on it. That conclusion, once demonstrated to be viable, is not easily contained.
Part IV: The Supply Chain Reality on the Ground
I want to shift now from the geopolitical and energy market analysis to the supply chain and logistics reality — because this is where the consequences become tangible for the professionals and businesses I work alongside every day.
The Hormuz Closure: A Stress Test Unlike Any Other
The Strait of Hormuz closure is not a hypothetical risk scenario from a supply chain resilience workshop. It is the current reality. And its consequences for global trade flows are severe.
Consider the scale of what normally flows through those 33 kilometres. Oil and gas from Saudi Arabia, UAE, Iraq, Kuwait, and Qatar. Chemical feedstocks for Asia’s manufacturing base. LNG shipments that power homes and factories across Europe and East Asia. Container vessels repositioning between Gulf ports. In normal times, the volume of trade that passes through Hormuz represents one of the most concentrated single-point dependencies in the entire global supply chain.
When it closes, the consequences spread outward in concentric rings.
The innermost ring: Gulf energy producers lose their primary export route. Revenues collapse. Foreign exchange reserves are drawn down. Government spending programmes are cut or delayed. The construction and infrastructure projects that drive demand for imported goods slow.
The second ring: Energy importers — particularly in Asia, where economies like India, China, Japan, and South Korea depend heavily on Gulf crude — face supply shortfalls. Energy prices spike. Manufacturing input costs rise. Competitiveness deteriorates. Consumer prices follow.
The third ring: Shipping routes are fundamentally disrupted. Vessels that previously transited Hormuz are rerouted — around the Cape of Good Hope if the Suez Canal is also constrained, or through the Red Sea if it is viable. These alternative routes add days to transit times, increase fuel consumption, raise freight rates, and strain port capacity at alternative hubs.
The fourth ring: Global supply chains built on assumptions of reliable Gulf energy and stable freight corridors face simultaneous input cost increases and lead time extensions. Manufacturers face rising energy costs at the same time as rising logistics costs. Retailers face stock shortfalls. Procurement teams scramble to secure alternative suppliers.
This is not a worst-case scenario. This is the current situation.
Fuel Costs: The Silent Inflation Tax on Every Supply Chain
With Brent crude at $111–113 per barrel and WTI above $100, fuel costs have become the dominant cost variable in freight operations. This is not a temporary spike — it is a structural shift driven by supply shock at the source.
For logistics operators, fuel cost management has moved from a line item in the budget to a strategic priority. Carrier contracts with fixed fuel assumptions are suddenly severely mispriced. Fuel surcharges — the mechanism by which freight carriers pass fuel cost volatility to shippers — are spiking in ways that are forcing businesses to renegotiate commercial agreements at short notice.
The practical consequence: businesses that were operating on thin landed cost margins in their supply chains are finding those margins compressed or eliminated. The economics of nearshoring versus offshoring are being recalculated. The viability of certain trade lanes is being questioned.
Freight Rate Volatility: Structural, Not Cyclical
The freight market’s response to the current crisis follows a pattern that supply chain professionals will recognise from COVID, from the Red Sea disruptions, and from earlier Gulf crises. But the pattern is being played out at greater scale and with more structural permanence.
Spot freight rates on trans-Pacific, Asia-Europe, and Middle East-Europe lanes have spiked sharply. Carriers are implementing General Rate Increases and War Risk Surcharges on Gulf-adjacent lanes. Vessel owners are demanding war risk premiums for transits through contested waters — or declining the routes entirely.
The underlying cause is not just supply and demand for shipping capacity. It is uncertainty. Shipping companies price uncertainty heavily, and the combination of Hormuz closure, Iran war, and now OPEC structural disruption represents a level of uncertainty that the market has not seen in decades.
For supply chain managers: spot rate exposure without contract protection is expensive right now. Building contract flexibility with multiple carriers across multiple routing options is not a nice-to-have — it is an operational imperative.
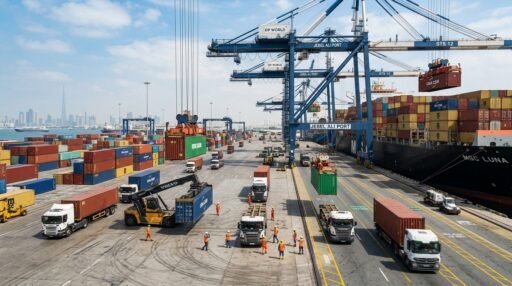
Port Congestion: The Downstream Consequence
When primary shipping routes are disrupted, cargo does not disappear — it reroutes. And rerouted cargo concentrates at alternative ports that were not designed to absorb the additional volume.
Port congestion at Salalah (Oman), Colombo (Sri Lanka), and Singapore — all key transshipment hubs for Asia-Middle East-Europe traffic — has increased significantly. Dwell times are extending. Equipment availability is tightening. Inland transport connections from ports to final distribution points are under strain.
For supply chain operators: port congestion adds invisible time to transit calculations. A shipment booked on a 25-day transit might arrive in 35 days because of congestion at the transshipment hub. Those extra 10 days have cascading effects on inventory levels, customer fulfilment commitments, and working capital.
Part V: The UAE’s Strategic Reset — What It Means for the Region’s Role in Global Trade
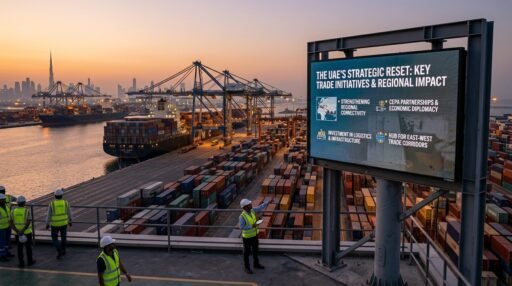
Stepping back from the immediate crisis, the UAE’s exit from OPEC needs to be understood within its broader strategic narrative — because that narrative has profound implications for the country’s role in global supply chains and trade.
The UAE has been executing a long-term diversification strategy for over a decade. The ambition: to transition from an oil-dependent economy to a global hub for trade, finance, technology, and advanced logistics. Jebel Ali Free Zone, Abu Dhabi Global Market, the Emirates Global Aluminium complex, ADNOC’s downstream expansion — all of these are pieces of a coherent strategy to embed the UAE at the centre of global value chains rather than merely at the beginning of the global energy supply chain.
Freedom from OPEC quotas accelerates this strategy in several specific ways.
First, higher production revenues — when the Strait reopens and UAE output ramps toward its 5 million barrels per day target — provide the fiscal resources to fund the diversification investments that Vision 2031 and beyond require. The UAE can fund infrastructure, technology, and education investments without drawing down sovereign wealth reserves.
Second, the UAE gains the freedom to structure long-term bilateral energy deals with key buyers — Asian refiners, European utilities, sovereign wealth fund counterparties — on its own terms. These deals, when structured well, embed the UAE as a preferred energy partner in ways that create durable strategic relationships beyond the energy sector itself. A country that supplies your energy is a country you treat as a partner in logistics, trade, and investment.
Third, freedom from OPEC constraints allows the UAE to integrate its energy strategy with its logistics and financial hub ambitions more fluidly. ADNOC has been developing downstream petrochemical and refining capacity. Combining upstream production freedom with downstream integration creates a much more powerful value proposition for industrial partners and investors.
For those of us who operate supply chains through the UAE — using Jebel Ali as a transshipment hub, routing cargo through UAE free zones, leveraging UAE financial infrastructure for trade finance — the strategic direction is clear: Abu Dhabi is playing a longer game than OPEC membership allowed.
Part VI: What Supply Chain Professionals Must Do Now

This section is practical. It is written for the freight forwarder trying to figure out how to price next quarter’s contracts, the procurement manager reassessing their supply base, the logistics director who needs to brief their CEO on what this means for the business.
1. Audit your fuel cost exposure — immediately
If your carrier contracts have fixed or capped fuel surcharges, you need to understand your exposure to rate increases above those caps. If you are running spot market freight without contract protection, you need to decide whether to secure forward capacity on key lanes before rates move further. Fuel cost is now the single largest variable in freight cost calculation, and it will remain volatile as long as Hormuz is constrained and the Iran situation remains unresolved.
2. Map your Hormuz dependency
This exercise sounds simple but most organisations have never done it properly. Map every significant input material, energy source, or finished goods flow that depends on the Gulf corridor — whether that is crude oil from Saudi Arabia, LPG from Kuwait, chemicals from Qatar, or manufactured goods shipped through Jebel Ali. For each dependency, identify the alternative sourcing or routing option. For each alternative, calculate the cost and lead time premium. This gives you a resilience matrix — a clear view of which dependencies are acceptable risks and which require active mitigation.
3. Revisit safety stock assumptions
Lean inventory models built on assumptions of 25-day Asia-Middle East transit times need to be recalibrated. If your supply chain is experiencing 35-day transits due to rerouting and port congestion, your safety stock calculations are wrong. The cost of carrying additional inventory is real, but it is almost certainly less than the cost of a stockout during a period of supply chain stress. Run the numbers. Many organisations will find that a modest increase in safety stock is the most cost-effective risk mitigation available.
4. Diversify your carrier relationships
Carrier concentration is a structural risk in any supply chain, but it is an acute risk in a disrupted market. Carriers that previously offered competitive rates on Gulf lanes may be repricing aggressively or withdrawing from certain routes. Having secondary and tertiary carrier relationships across multiple routing options — not just Hormuz but Cape of Good Hope, overland through Central Asia, air freight for critical components — gives you operational flexibility that carrier concentration denies you.
5. Build dynamic fuel surcharge mechanisms into new contracts
Any commercial agreement you are signing or renewing in the current environment should include a dynamic fuel surcharge mechanism that reflects actual market fuel costs rather than a fixed assumption. This is a negotiating conversation that requires data — benchmarking your fuel surcharge exposure against published indices like Platts or IATA fuel monitor data. Do not sign contracts with fixed fuel assumptions based on pre-crisis oil prices.
6. Engage your finance team on currency and trade finance risk
Energy price volatility creates currency volatility. Countries that depend heavily on Gulf energy imports — India, Japan, South Korea — face current account pressures when oil prices spike that can move their currencies significantly against the US dollar. If you are buying or selling goods priced in those currencies, the energy shock creates an indirect exposure that your treasury function needs to manage. Similarly, trade finance availability can tighten in periods of geopolitical stress — ensure your credit lines and letters of credit facilities are confirmed and available.
7. Watch the Kazakhstan decision
If Kazakhstan follows the UAE out of OPEC+, the cartel’s production coordination becomes even less effective. That scenario creates a bifurcated oil market — a smaller, Saudi-led OPEC bloc managing prices through cuts on one side, and a growing group of independent producers pursuing market share on the other. This bifurcation, if it materialises, would structurally lower the floor on oil prices over the medium term — which would eventually benefit fuel-cost-sensitive logistics operations — but would increase short-term volatility. Scenario planning for both outcomes is worth the time.
Part VII: A Note on Opportunity
I have spent most of this piece on risk — because risk is immediate and requires active management. But I want to close with something that I believe equally strongly from two decades of operating through disrupted markets: every structural disruption creates structural opportunity.
The closure of Hormuz is accelerating investment in alternative energy infrastructure. The UAE’s East-West pipeline — the Abu Dhabi Crude Oil Pipeline — runs from Abu Dhabi to the Fujairah terminal on the Gulf of Oman, bypassing Hormuz entirely. Fujairah is becoming one of the most strategically important oil terminals in the world. Infrastructure investment that flows through Fujairah creates logistics and warehousing opportunities along the East-West corridor.
The disruption of established Gulf shipping lanes is accelerating the development of alternative overland routes — the Trans-Caspian route, Central Asian rail corridors, and the India-Middle East-Europe Corridor (IMEC). For freight forwarders and multimodal logistics providers, these alternative corridors will see volume and investment that did not exist two years ago.
The UAE’s freedom from OPEC constraints accelerates its ambition as a global logistics hub. Jebel Ali’s already formidable position as a transshipment centre, combined with the UAE’s growing role as an advanced manufacturing and free zone destination, creates a sustained demand for sophisticated logistics services. That demand will not shrink because of the current crisis — it will grow.
And at the macro level: if the Strait of Hormuz eventually reopens, and if UAE production ramps toward 5–6 million barrels per day without OPEC constraints, the medium-term direction for oil prices is downward. Lower, more stable energy costs would be a significant tailwind for global trade volumes and logistics demand. The businesses that build resilience and capability through the current disruption will be positioned to grow faster when conditions normalise.
Conclusion: The Map Is Being Redrawn

The UAE’s departure from OPEC is a marker in history — one of those events that looks, in retrospect, like the moment a previous era ended and a new one began.
The era ending is one in which OPEC — led by Saudi Arabia, anchored by Gulf solidarity — functioned as the central price-setting mechanism for global energy. That era was already weakening as US shale production grew, as renewable energy displaced oil demand in certain markets, and as the Gulf states’ own strategic interests began to diverge. The Iran war accelerated a rupture that was already developing.
The era beginning is one in which major oil producers operate with more independence, price signals come from a wider set of actors, and the geographic structure of global energy and trade flows is being actively redrawn. The Strait of Hormuz will not be the only answer to the question of how oil reaches global markets. New corridors, new bilateral deals, and new infrastructure will fill the spaces that the old order is vacating.
For supply chain and logistics professionals, the practical message is this: the assumptions that structured your supply chain three years ago — about energy costs, transit routes, freight rates, inventory levels, and supplier geography — need to be revisited. Not as a theoretical exercise, but as an operational priority.
The world is not going back to the way it was. The UAE understood that. Now we all need to.
Arshad Azhar is a Director of Logistics & Freight Forwarding with 20+ years of GCC supply chain experience. He is the published author of “Navigating Path to Sustainable Logistics” and “Forever Young: Mastering Reverse Aging with the 8 Principles of Intelligence.” He writes at the intersection of logistics operations, energy markets, and supply chain strategy for GCC and global audiences.
If this piece was useful, share it with someone in logistics, procurement, or trade finance. They need to read it.
Subscribe to UAE Trade Brief on Substack for weekly analysis of the trends reshaping GCC trade and supply chains.
Tags: #OPEC #UAE #SupplyChain #Logistics #GlobalTrade #FreightForwarding #GCC #EnergyMarkets #StraitOfHormuz #SupplyChainResilience #ADNOC #FreightRates #Procurement #LogisticsLeadership